aloeUI Quick Start Guide
This page describes how to setup and run the aloeUI front-end and its basic commands. The guide assumes the reader knows basic ALOE usage.
The GUI is written in JAVA therefore it is expected to run on all platforms (only Linux has been tested)
Running the UI
The UI is distributed with the ALOE package in jar format (see QuickStartGuide). For those interested on getting sources check http://flexnets.upc.edu/svn/phalgui/
on your shell prompt, type:
java -jar aloeui/phalgui.jar
A sreen like this should show up:
Setup
Click on "ALOE Management", you will see a menu with three items:
- Applications: Available waveforms in the active repository.
- Platforms: Platforms the UI can connect to.
- Panels: Statistics view panels.
Now we want to configure our first platform which will be the local platform. 1) Right-click on Platforms and select New Platform. 2) Enter any name, for example, "localPlatform". 3) Right-click on the new platform and select "Edit". A form will appear in the right window where you can select how to connect to the platform. For a default local connection, choose the following options.
Click on "Browse" near Output log path to select the path to the output.log file generated by ALOE (this is optional)
4) Click Save.
Now we have to start ALOE. Open a console shell, go to the aloe base directory and type (see ALOELinuxGuide):
sudo runph
Back to the GUI, right-click on the new platform and select "Connect". You should see the status bar displaying: "Connected".
Now we will configure the repository for the waveforms. 1) Right-click on the "Applications" top-level menu and select "Edit". 2) On the form appearing on the right side of the screen, click the "Browse" button and select the path to the repository directory. By default it should be under the aloe base directory extracted from the source tar. 3) Click on Save. You should see how new applications are available on the Applications menu on the left.
Running a Waveform
Now we can LOAD/INIT/RUN a waveform by selecting it on the left side and click on buttons on the top-left. When a waveform is selected, the set of its components are displayed. You can see its logs or view/report statistics.
To view a log, for example, just double-click on the Log icon.
Viewing/modifying Statistics
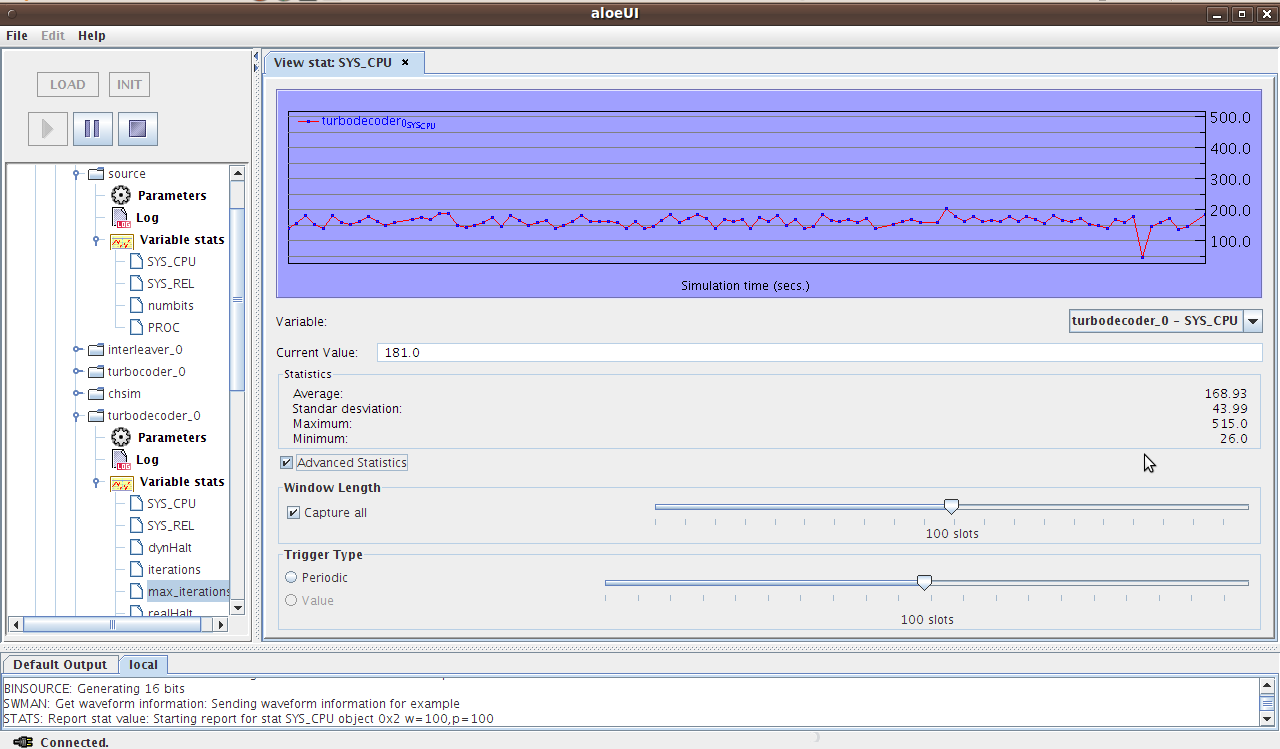
Time evolution of statistic variables can be reported and viewed graphically. To start reporting a variable right-click on the variable under statistics menu and select "Start Reporting". A window will appear like this:
You have two options to select:
- Period: Selects how often data is reported and saved in the report log file.
- Window: Selects the number of samples to capture each report.
Now you can add another variable to the same graph (it will use the same report and window options) by dragging a variable to the graphics area.
To see a histogram of the captured values. Right-click on the grey part of the right screen and select Histogram. The screen will become like this:
You can select the number of bins of the histogram as well as the intervals to draw. In addition, you can choose to accumulate data on time or discard it when a new report is received.
There are two fixed variables for every component in ALOE reporting the CPU usage. They are:
- SYS_CPU: Consumed CPU time on every time slot.
- SYS_REL: Time the module relinquishes the CPU on every time slot.
In addition, those modules using the module.c/module_imp.c skeleton will automatically have another variable:
- PROC: Consumed CPU in the processing function. This variable measures the time consumed in data processing, not counting the time spent in sending/receiving data or other overhead. This data is useful to measure exact ALOE's overhead.
Viewing Execution Statistics
Execution information can bee seen in two forms:
- Numeric table
- Graphic Diagram
To see the information in numerical format, right click on a loaded waveform and select RT Info. It will show a screen like this:
Where you can see the used CPU, maximum used CPU, mean/variance of the execution time relation and the time the process relinquished the CPU.
If you prefer to see the measurements graphically, select RT Diagram after right clicking. This will show a grant diagram of the scheduling of the execution of processes on every time-slot. Each row represents a different processor (or core). Note that as the execution position is constant in time, the diagram is also constant for every time-slot (except for small variations on the execution time.
Attachments
- histogram.png (74.1 KB) - added by ismael 16 years ago.
- detail.png (45.8 KB) - added by ismael 16 years ago.
- platform.png (38.0 KB) - added by ismael 16 years ago.
- report.png (66.7 KB) - added by ismael 16 years ago.
- rtdiagram.png (73.5 KB) - added by ismael 16 years ago.
- rtinfo.png (74.0 KB) - added by ismael 16 years ago.
- setup.png (17.8 KB) - added by ismael 16 years ago.


